
Rising Wedge Pattern
Categories: Trade and Investing |
Published by: Rachna Timalsena
11/07/2024
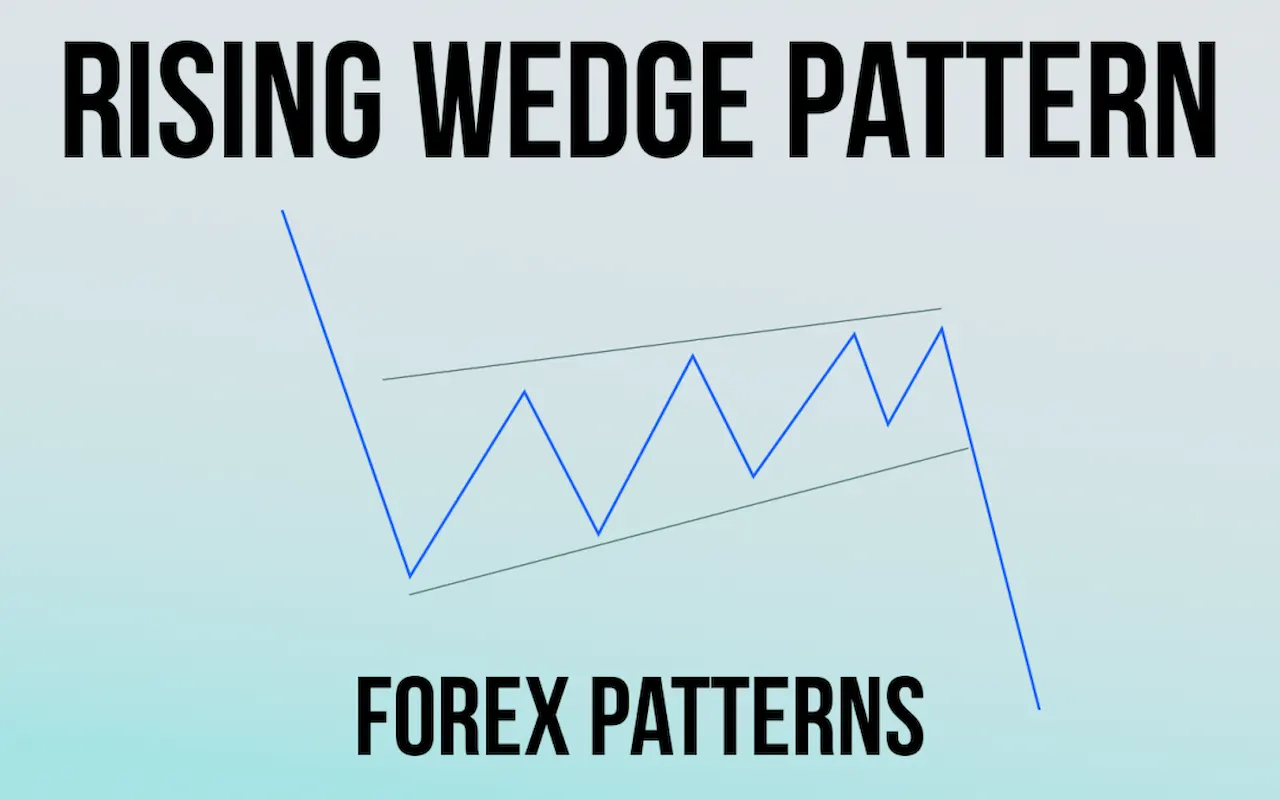
The rising wedge pattern is a tool in technical analysis that often shows a potential move in the asset or broader market. Traders spot this pattern by identifying a narrowing range of prices between two upward-sloping trend lines that come together over time. A rising wedge can indicate either a continuation or a reversal in the trend, with continuation being more frequent and effective as it follows the overall trend direction.
This blog post covers the rising wedge formation, its key characteristics, trading strategies, and FAQs.
Formation of Rising Wedge Pattern
The rising wedge pattern usually forms after a price increase and indicates a possible change in direction for the security’s price. Traders often see this as a bearish sign in technical analysis. It’s identified by trendlines that come together, with both the support and resistance lines sloping upward. However, the support line slopes more steeply than the resistance line.
Characteristics of a Rising Wedge Pattern
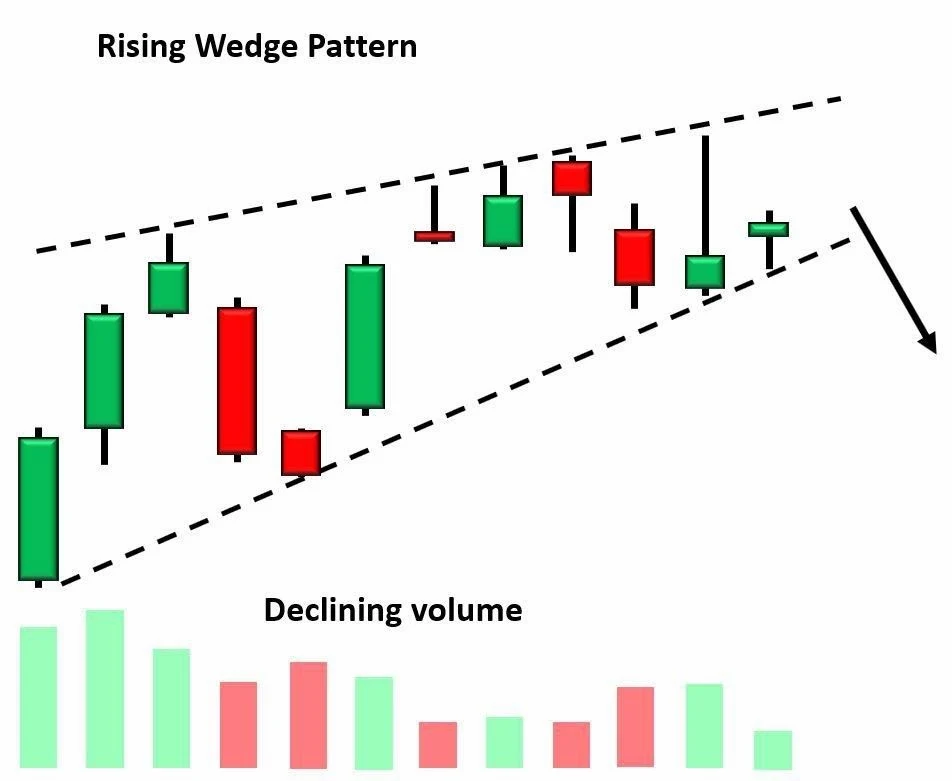
The rising wedge pattern in technical analysis predicts a likely bearish reversal. It shows a narrowing price range with higher highs and higher lows, bounded by upward sloping trendlines.
The support line slopes steeper than the resistance line, causing them to converge over time.
Key features include:
- Upward Trend: Forms during a price uptrend.
- Converging Trendlines: Both lines slope up and come together as the pattern matures.
- Volume: Decreases as the pattern forms, strengthening the bearish signal.
- Breakout: Confirmed when the price falls below the lower support trendline, signalling a potential bearish reversal.
The rising wedge pattern is seen as bearish because it suggests buying momentum is slowing. The narrowing range and lower volume indicate buyers may be losing control, increasing the likelihood of a downward price break. Like all financial models, the rising wedge isn’t foolproof. Traders and investors use it alongside other strategies for a diversified approach.
Trading the Rising Wedge Pattern
Trading a rising wedge pattern involves a sequence of steps to benefit from a bearish signal for a trend reversal. The procedure is as follows:
1. Identify
First, find the rising wedge pattern on the chart. Look for converging upward sloping trend lines showing better highs and higher lows. This sample commonly reports an uptrend.
2. Confirm
Wait for confirmation before buying and selling. This often comes close to breaking the rate below the lower trendline. A low buying and selling range during a wedge formation can confirm this sign.
3. Entry
Once revealed, traders regularly go fast. They enter the stock market at a breakout point below the downtrend line.
4. Stop Loss
Set the stop loss just above the last excessive value within the sample. This limits losses if the sample fails and the charge builds up again.
5. Target
Calculate the target by measuring the top of the pattern at its widest point and subtracting it from the degree of puncture. Some buyers use Fibonacci phases for more specific goals.
6. Risk Management
Effective threat control is important. Adjust position sizes and use technical indicators like RSI or MACD to validate the pattern.
7. Exit
Exits the exchange when the price reaches the target. Monitor other technical markers and market information for potential charge impacts.
Conclusion
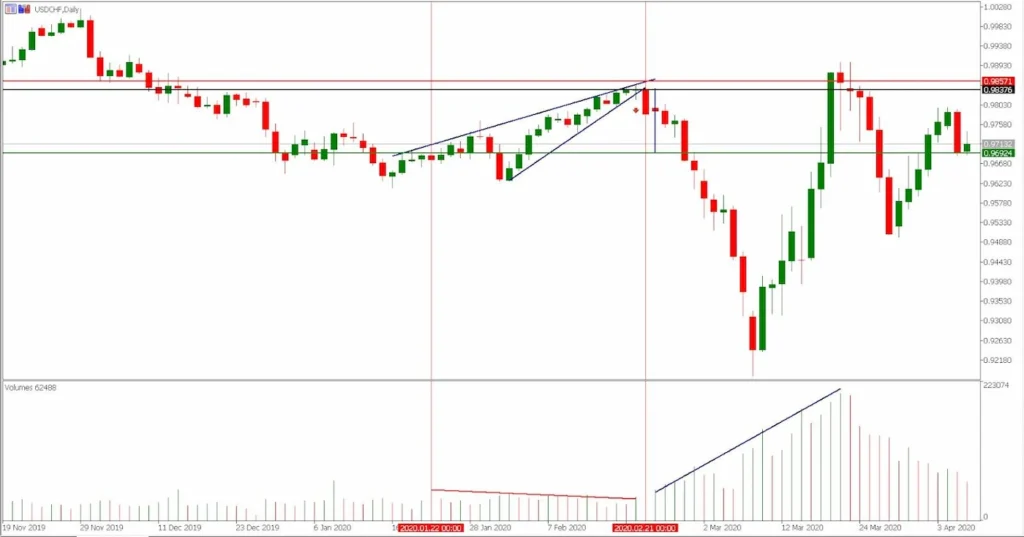
To recognize and trade a rising wedge pattern, you need to spot converging trend lines that slope upwards during an uptrend (for reversal) or downtrend (for continuation). Confirm the pattern by watching for the price to break below the lower support trendline, usually with less trading volume.
Traders usually sell at this point, placing a stop loss order above the last high within the pattern and aiming for a price calculated by subtracting the pattern’s height from the breakout level. Traders and investors often use extra technical indicators to confirm their decisions.
FAQs
Is the rising wedge bullish or bearish?
A rising wedge usually indicates a bearish sign as it indicates a likely reversal in the uptrend. When a fee breaks below a downtrend line, it often indicates that costs could fall.
What does a rising wedge pattern mean?
A rising wedge pattern is approaching where the charge should decline as the upward momentum slows. Traders are looking ahead to a breakout to verify this ability to the downside.
Is the rising wedge pattern consistently accurate?
No, like several technical patterns, the rising wedge pattern is not usually correct.
What are the common mistakes traders make with the rising wedge pattern?
Traders usually make mistakes along with overtrading, now not following breakout confirmations and ignoring broader market factors. To avoid this, traders should follow a buy and sell plan, use risk control techniques and stay up-to-date on relevant information.
Does a rising wedge pattern appear in all economic markets?
Yes, rising wedge styles can be seen in many economic markets such as stocks, currencies, commodities and more. Analysts use this pattern for different types of things.
Related read: