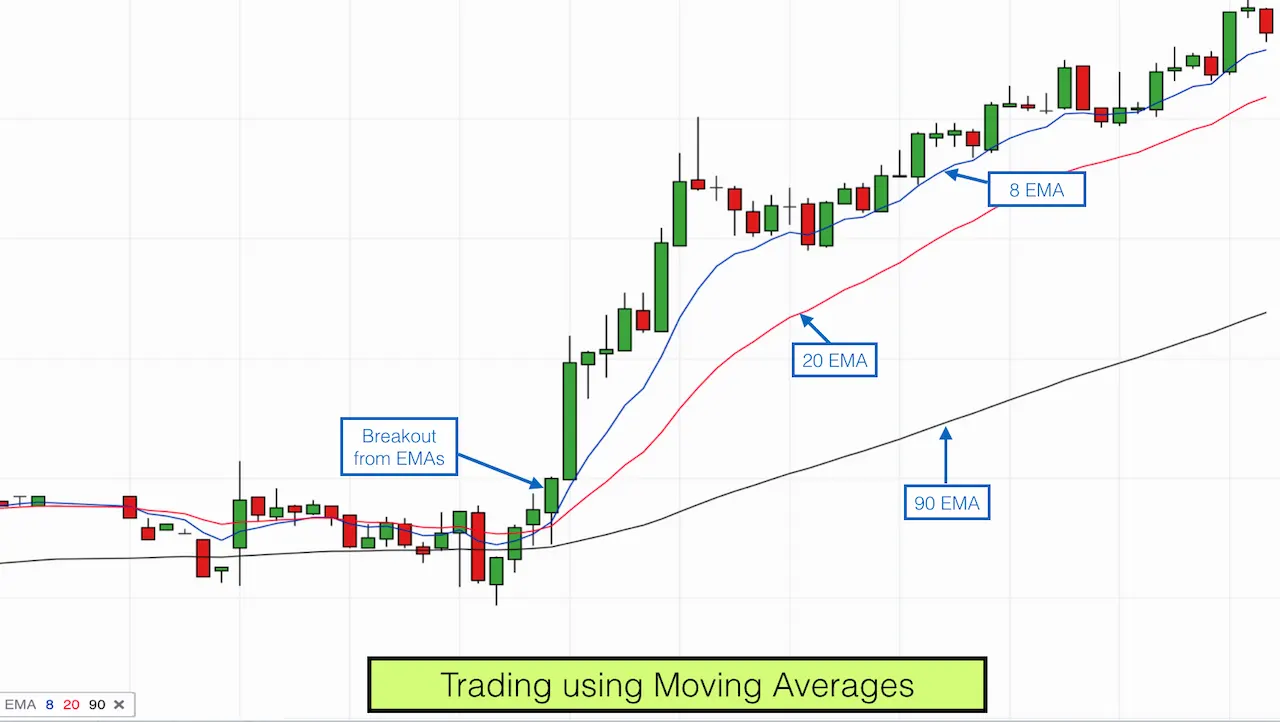
What are Moving Averages?

A moving average (MA) is a common tool in technical analysis to track stock prices. Calculating a moving average helps smooth out price data by creating an updated average price, reducing the impact of short-term price changes. Simple moving averages (SMAs) use an arithmetic average of prices over a set period, while exponential moving averages (EMAs) give more weight to recent prices. In this blog, we’ll explain how to choose the right length for a moving average, provide examples, discuss common questions, and show how to apply them to your trading strategy.
How to Choose the Right “Length” for a Moving Average
The “length” or the number of periods used in a moving average calculation determines its appearance on a price chart.
- A shorter length will mean fewer data points and hence the moving average will remain closer to the current price. This may reduce its effectiveness and give less information concerning the general trend than having only one recent price itself.
- On the other hand, longer lengths consist of more data points that make individual price changes have less effect on it. If there are too many data points, then price moves may get very smooth making it hard to discern any trends.
This is crucial because it enables you to see how much detailed pricing matches your trading time frame.
As such, you might be thinking, “how do I use this for trading?”
There are two main types of moving averages:
- Simple Moving Average (SMA)
- Exponential Moving Average (EMA)
Example of a Moving Average
The calculation method depends on the type of moving average. Below is an example using a simple moving average (SMA) with the following closing prices over 15 days:
- Week 1 (5 days): 20, 22, 24, 25, 23
- Week 2 (5 days): 26, 28, 26, 29, 27
- Week 3 (5 days): 28, 30, 27, 29, 28
A 10-day moving average would average the closing prices for the first 10 days as the first data point. The next data point would drop the earliest price, add the price on day 11, and then take the average.
Conclusion
In conclusion, knowing what moving averages mean is important for effective stock buying. By choosing appropriate length and type of moving average you can better analyze price trends and thus make more informed choices. When the moving average rises, it indicates the stock is in an uptrend. When it falls, it indicates a downtrend. Many prefer the exponential moving average over the simple moving average because it gives more importance to recent prices, making it more responsive to new information and trends.
FAQs
What does a Moving Average Indicate?
A moving average shows the average change in a data series over time, indicating price trends for specific securities.
What are Moving Averages Used for?
Moving averages help technical analysts detect and confirm changes in the momentum of a security’s price.
What are Some Examples of Moving Averages?
Examples of moving averages include the exponential moving average (EMA), which gives more weight to recent days, and the simple moving average, which averages prices equally.
Related Reads:

